Sickness absence rate in the UK highest since 2010
Monday 24th October 2022

The sickness absence rate in the UK in 2021 rose to 2.2%, from a record low of 1.8% in 2020; this is the highest it has been since 2010, when it was also 2.2%. An estimated 149.3 million working days were lost because of sickness or injury in the UK in 2021, equivalent to 4.6 days per worker.
The groups with the highest rates of sickness absence in 2021 included women, older workers, those with long-term health conditions, people working part-time and people working in caring, leisure and other service occupations.
Sick days in the UK resulted in a £20.6bn cost to the UK economy last year, an additional £3.7bn vs. 2020.
Following the recent release of ONS data analysing the increase in sick days between 2021 and 2020, we've looked into the financial impact on the UK economy, discovering that absences resulted in a total cost of £20.6bn - an additional cost of £3.7bn. COVID-19 accounted for 24.0% of all occurrences of sickness absence in 2021, up from 13.9% in 2020, which is to be expected due to the increase in accessibility to home testing in 2021.
Which groups have the highest sickness absence rates?
We have also examined the split between gender and location. Men lost 1.8% of their working hours in 2021 (an increase of 0.3 percentage points from 2020) as a result of sickness or injury and women lost 2.6% of their working hours (an increase of 0.3 percentage points from 2020).

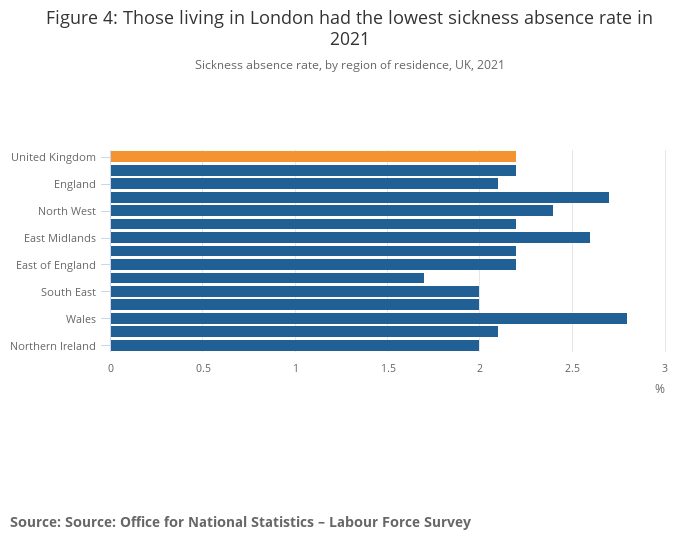
In 2021, as in previous years, workers living in Wales had the highest sickness absence rate (2.8%). Those living in London had the lowest sickness absence rate (1.7%), 0.5 percentage points below the UK average.
This can be largely explained by the younger age profile of people and workers living in London and the types of occupations that they have. There is a large concentration of high-skilled jobs in London that workers can often do from home, enabling them to work whilst potentially not feeling 100% resulting in lower rates of sickness absence.

Commenting on the research, John Atkinson, our Head of Commercial Business, said:
“It’s bad news for many that the number of sick days Brits are taking increased last year, although this was to be expected during the pandemic with home testing being much more accessible in 2021 vs. 2020.
For small businesses and SMEs sickness can be a huge issue, and with businesses already struggling, the cost to them in additional sick days is likely to cause more stress by further stretching budgets during a time where the costs of running a business are already significantly higher for many than they were last year.
While Brits taking more sick days will have an overall negative financial impact on both businesses and the economy as a whole, it’s important that people feel as though they can take them without judgement, particularly as many of us are now working from home on a more regular basis.
Luckily, there are finance options available like our invoice finance solutions for those struggling with their cash flow during these tough times!”
Sickness absence rate - methodology
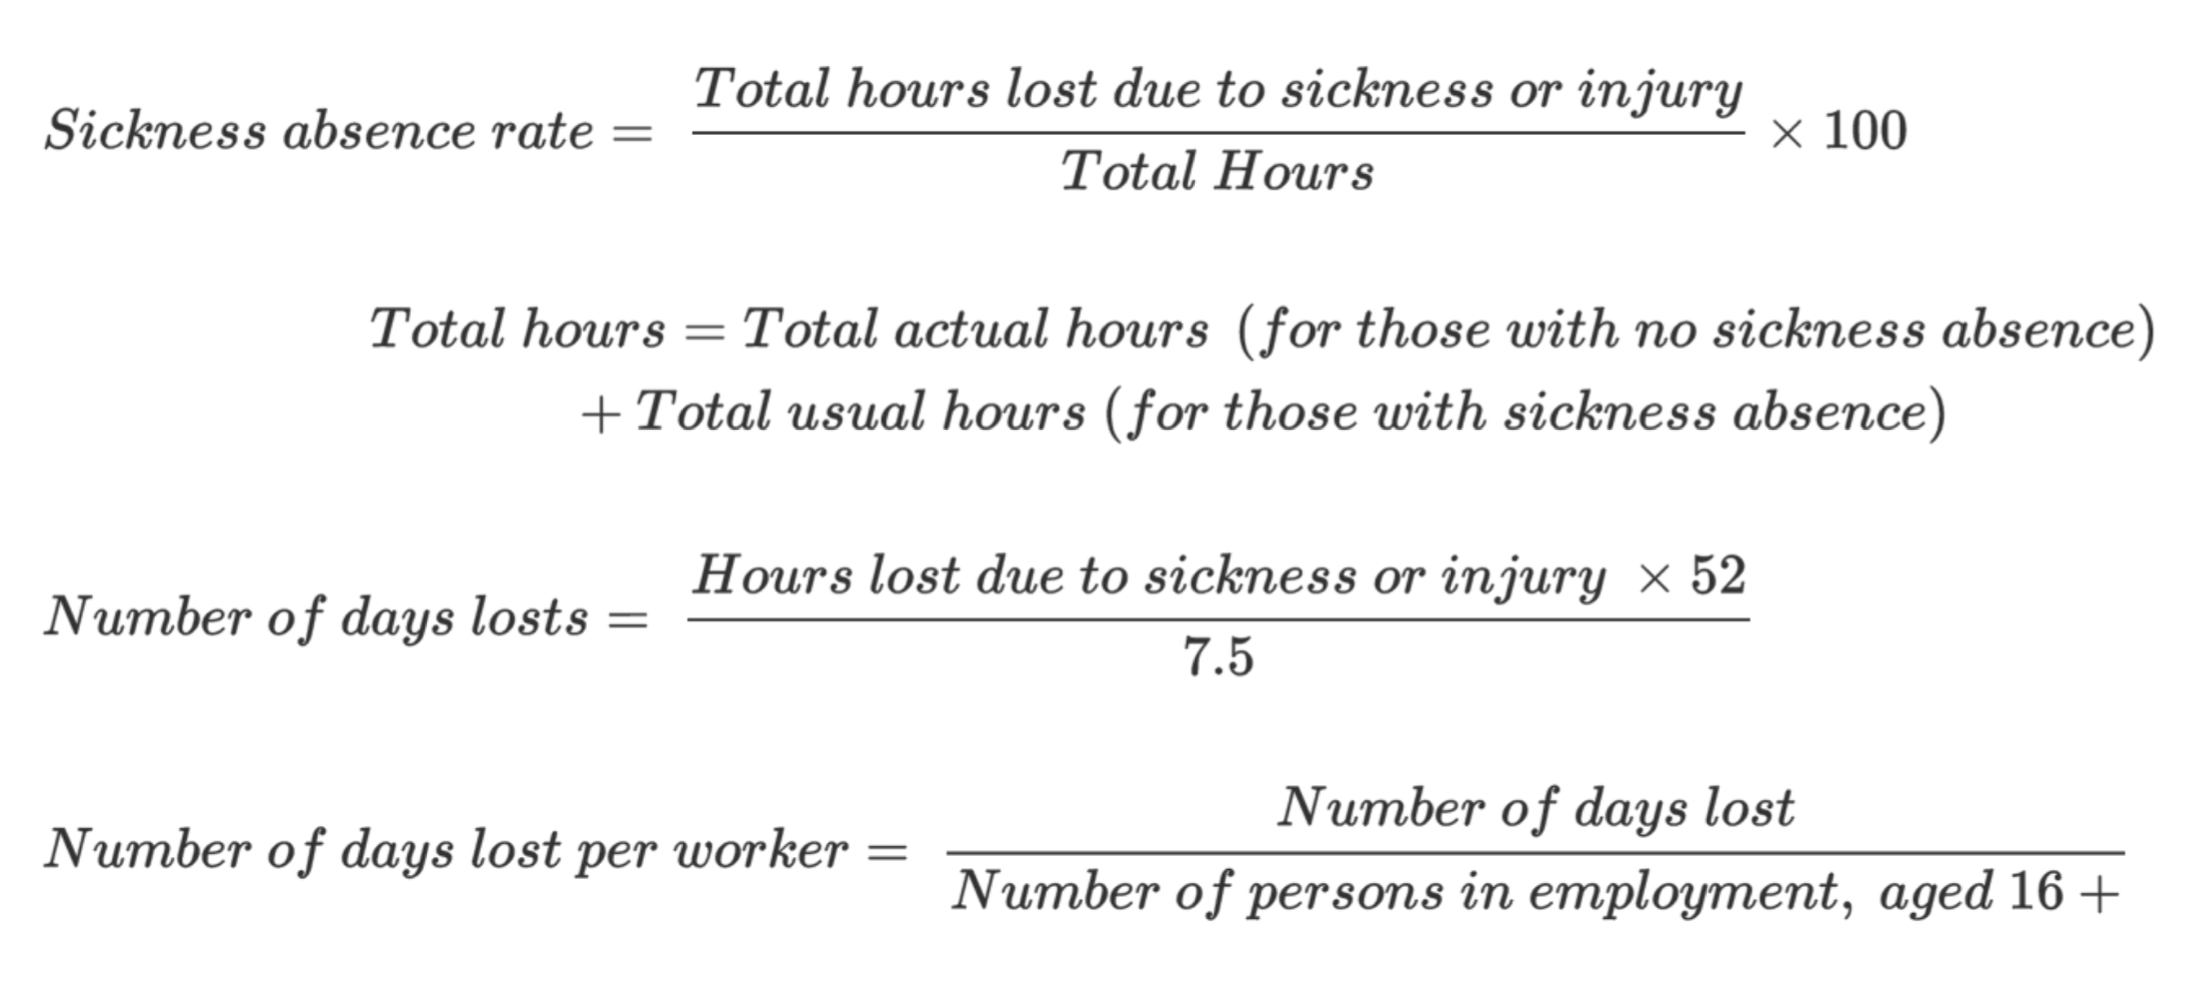
Sickness absence rate is proportional to the total hours lost because of sickness or injury divided by total hours multiplied by 100, as seen in the following formula:

The sickness absence rate will not be affected by furloughed workers in the same way as the number of days lost. This is derived as the total hours lost as a proportion of total hours worked. While there will be less hours lost and less hours worked, those contributing to both totals are consistent, therefore this measure should still be comparable over time. Since this measure is least affected by the coronavirus pandemic policies, it is therefore the most appropriate measure to use for sickness absence analysis to ensure comparability over time.
Cost to the UK economy - methodology
Data is for January to December 12 month average
Number of working days
- 255 working days in 2021 (104 weekends)
- 28 days holiday average (inc. bank holidays) source
- Total working days per year (2021) = 255 - 28 = 227
Value of days lost
- Approx. 32,356,000 in employment in 2021 (median average) source
- Approx. 32,554,500 in employment in 2020 (median average) source
- Average = 32,455,250
- Median average salary in 2021 was £31,285 (full time) - source
- Median average salary in 2020 was £31,387 (full time) - source
- Average = £31,336
- 1 working day is worth £31,336/227 = £138
Difference YoY = £3.7bn


